2019-20 Teacher Salary Data
Find data on the average teacher salaries, highest and lowest salaries, benefits plans and more under the staff tab of the district profile.
Read More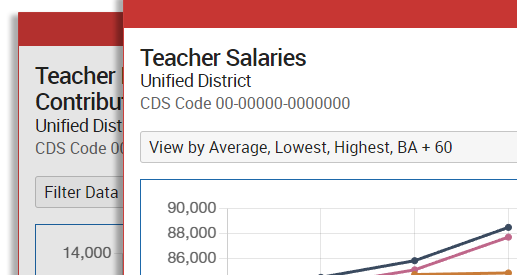
2018 CAASPP Smarter Balanced test results
You can now view and compare four years of results on the state's math and English standardized tests. See detailed data on the progress made by schools, districts, counties and the state or compare schools and districts using the test results data.
Read More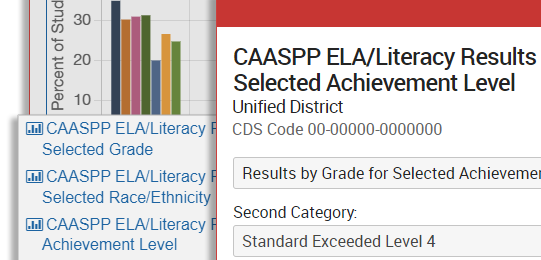
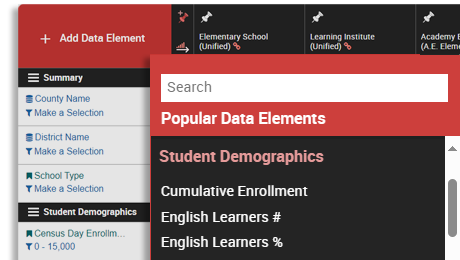
View and compare data for multiple schools or districts
Ed-Data school and district comparisons are a powerful tool for looking at multiple data sets in one place.
Read More